Nerd notes
Notes about elevation data and total altitude gain
The tracks have been composited from bits of trail with actual GPS altitude measurements, and bits of trail plotted by hand using aerial imagery. When it comes to elevation, both have problems, and the end result of it is that the total elevation gain/loss in the descriptions below is much overestimated, depending on terrain and foliage.
GPS measurement errors
GPS measurements are usually accurate to a degree of a meter or so. This means that while you're going flat at sea level, the GPS could for instance measure subsequently -1m, 1m, 1m, 0m, 1m, -1m for the altitude component. The interesting thing is that these errors add up: for this example series of measurements, the total altitude gain is 3m while you were actually cycling on the flat all the time, at 0m! Thus, GPS measurements generally overestimate altitude gain and loss: they make the terrain appear bumpier than it is. There's little you can do about it — there's usually some correction filters inside the GPS to smooth such bumps, but you can't have too much of it, because what if someone is actually riding a bumpy trail?
This is also the reason why you and your buddies' Strava altitude gains can be much different even while you've been riding together. Different phones have different GPS accuracies, and different smoothing algorithms.
Map-drawn trails and sattelite altitude measurements
Many parts of the trails are traced on a map, with altitude information added in through a digital elevation map. Again, there are accuracy problems with this method.
Elevation map resolution
The digital elevation maps have measurement errors, just like GPS, but on top of that, they do not have unlimited resolution. Thus, to assign elevation to a single point on the trail, it will give you the elevation of some point nearby that it does have information for - or an attempt is made to interpolate between some data points around your point. Point is, suppose your trail crosses a steep ravine, like so:
 A           C
____       ____
    \     /
     \ B /
      \_/
If the elevation map only has elevation data for point A and C, your efforts to get down and up the other side will not be reflected in the elevation profile - point B will be interpolated to be at the same altitude as A and C, and the computer will think you were just very slow, going flat between A and C. This error can work the other way as well of course, overestimating your elevation gain/loss — depending on your direction of travel through the terrain, and alignment of the digital elevation map grid to it, truly pathological scenarios are possible. Ravines and switchbacks in particular are problematic. Day 2 for the Kapaas route sees a lot of switchbacks!
Foliage
Most elevation maps are created using sattelites, see here for how that works. This works quite well for roads under open skies, but what if you have magnificent tropical trees towering over the road? To the sattelite, the road is obscured by a quite bumpy canopy profile. Again, this has an adverse effect on the total altitude gain calculated.
See for yourself
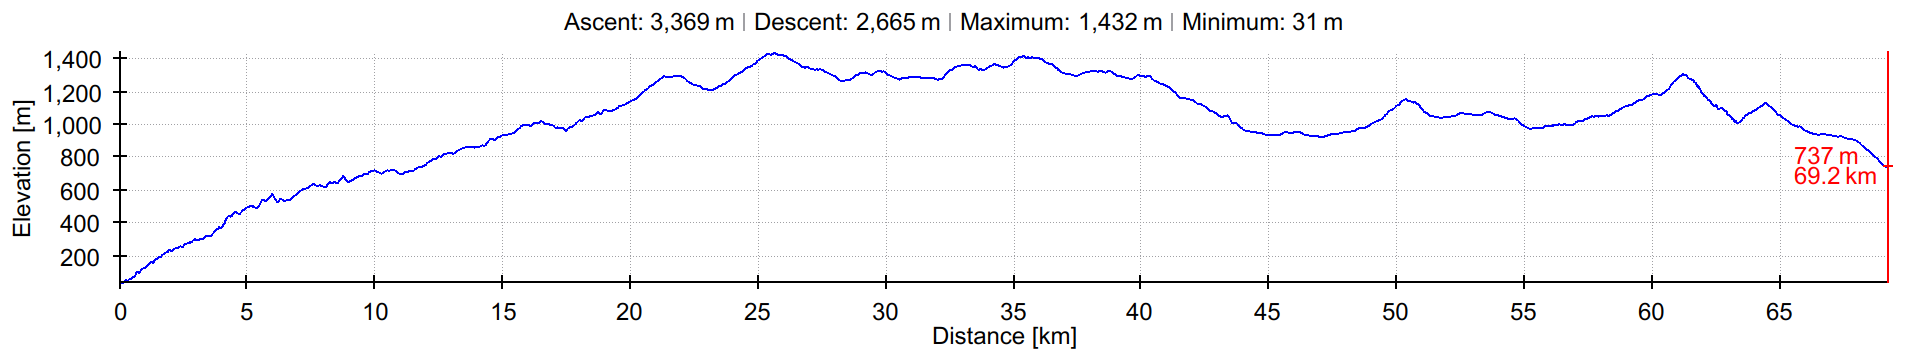
Sometimes these errors are even visible by the naked eye on the altitude profile itself — take for instance the Kapaas stage 1 profile which was made using digital elevation maps. Zooming in you see that up to KM30 the altitude profile looks quite serrated on the micro-level, while after it it becomes much smoother. This coincides with trading the tree cover for a much more open highland landscape. On top of that, the highland landscape has a rolling quality to it, and the trails cross it without too many switchbacks - a stark contrast with the way up.